if your java version below 1.4.2 then you need to download latest java version and install it.
download latest java from the below link;
latest java
installation java on redhat
Step 1: installing rpm;
[oracle@isupdbsh opt]$ rpm -ivh jdk-7u9-linux-x64.rpm
Step 2: installation and configuration java
[oracle@isupdbsh /]$ alternatives --install /usr/bin/java java /usr/java/jdk1.7.0_09/jre/bin/java 1
[oracle@isupdbsh /]$ alternatives --config java
There are 2 programs which provide 'java'.
Selection Command
-----------------------------------------------
* 1 /usr/lib/jvm/jre-1.4.2-gcj/bin/java
+ 2 /usr/java/jdk1.7.0_09/jre/bin/java
Enter to keep the current selection[+], or type selection number: 2
select the new location installed java and check java version;
[oracle@isupdbsh /]$ java -version
java version "1.7.0_09"
Java(TM) SE Runtime Environment (build 1.7.0_09-b05)
Java HotSpot(TM) 64-Bit Server VM (build 23.5-b02, mixed mode)
OS Watcher Installation Guide;
You can download os watcher from the below link or download from metalink (ID 301137.1)
Step 1: Extracting downloaded file
[root@isupdbsh opt]# tar -xvf oswbb5201.tar
Step 2: Configuration oswbb service;
[root@isupdbsh oswbb]# cp Exampleprivate.net private.net
[root@isupdbsh oswbb]# vi private.net
modify private.net like below;
######################################################################
# This file contains examples of how to monitor private networks. To
# monitor your private networks create an executable file in this same
# directory named private.net. Use the example for your host os below.
# Make sure not to remove the last line in this file. Your file
# private.net MUST contain the rm lock.file line.
######################################################################
#Linux Example
######################################################################
echo "zzz ***"`date`
traceroute -r -F isupdbsh
traceroute -r -F isupdbbim
######################################################################
# DO NOT DELETE THE FOLLOWING LINE!!!!!!!!!!!!!!!!!!!!!
#
######################################################################
rm locks/lock.file
remove unnecessary lines and modify traceroute -r -F.
Step 3: Starting oswbb service;
[root@isupdbsh oswbb]# ./startOSWbb.sh
from now, os watcher will gather any information about System Memory,System CPU Utilization,System I/O etc...
there are some folders,which are important to find out whats going on operating system, under oswbb directory . these folders are: analysis,profile and archive;
Step 4: How to create profile and save as html;
[oracle@isupdbsh oswbb]$ java -jar oswbba.jar -i archive -6 -7 -8 -P crash -L /opt/oswbb/gif/ -B DEC 06 10:00:00 2012 -E DEC 06 11:00:00 2012
parameters:
-6 : Will generate all cpu gif files.
-7 : Will generate all memory gif files.
-8 : Will generate all disk gif files.
-P :User specified name of the html profile generated by OSWg
-L : User specified location of an existing directory to place any gif files generated by OSWg
-B :The start time will allow the user to select a start time from within the archive of files to graph/profile
-E : The end time will allow the user to select an end time from within the archive of files to graph/profile
Now check profile folder under oswbb and inside crash folder open OSW_profile.htm and also os watcher generates gifs information about operating system between 06.12.2012 10:00:00 and 06.12.2012:11:00.
some screenshots of profile output generated by os watcher;
and also check /opt/oswbb/analysis folder to get some usefull information about cpu,memory, I/O,Net.
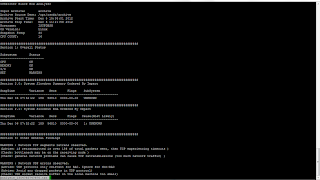
screenshot of text file generated by OSWatcher Black Box Analyzer;
step 5: Diagnostic Data Output;
oswiostat
oswmpstat
oswnetstat
oswprvtnet
oswps
oswtop
oswvmstat
when u check these folders under /opt/oswbb/archive/, there are many files with .data extension and each folders hold information about operating system.U can check these .data files(Example of file under each folders : isupdbsh_netstat_12.12.06.1100.dat).
P.s : If u want to change SnapshotInterval and ArchiveInterval then u need to start service like the below command;
./startOSWbb.sh ARG1 ARG2;
Example:
./startOSWbb.sh 60 24
collect every 1 minute and keep 24 hours of archive files.
- Erol
- Erol


Wow what a great blog, i really enjoyed reading this, good luck in your work. File I/O Monitor
ReplyDelete